Why College Football 2026 Rewrites the Numbers
College football is the NCAA-based American football system in the United States, led by Football Bowl Subdivision programs, conference schedules, rankings, and the College Football Playoff. The 2026....

Why College Football 2026 Rewrites the Numbers
College football is the NCAA-based American football system in the United States, led by Football Bowl Subdivision programs, conference schedules, rankings, and the College Football Playoff. The 2026 season begins with Week 1 running from August 22 to September 7, while the CFP National Championship is scheduled for January 25, 2027, at Allegiant Stadium in Las Vegas. ESPN lists 15 regular-season weeks, bowl games from December 13 through January 27, and CFP fixtures beginning December 18. The competitive map includes the ACC, Big Ten, Big 12, SEC, American Athletic Conference, Mountain West, Sun Belt, Conference USA, MAC, Pac-12, and FBS independents. Game analysis should combine venue, travel, injuries, efficiency, and market movement rather than rankings alone. Start by confirming the official schedule, then compare team data before making any prediction or financial decision.

Photo by El gringo photo on Pexels
College football is not simply “professional football with younger players.” It is a large, layered competition involving universities, conferences, student-athletes, alumni, television networks, and increasingly complex postseason structures. The NCAA governs the sport’s broad framework, while conference offices manage schedules, membership, and competition rules. Meanwhile, ESPN, CBS Sports, NBC, FOX, and ABC influence when millions of viewers can actually watch the games.
For us, the practical question is more urgent: how do we read college football without being trapped by reputation? A famous program can be overvalued. A road favorite can be exposed by travel. A total of 49.5 points can look attractive until weather, offensive line injuries, and pace data destroy the original assumption. Goal Moments covers match predictions, tactical analysis, player statistics, and major tournament stories, but college football requires its own evidence-first method. Treat every “official” narrative as a hypothesis, not a conclusion.
Want a broader sports-analysis framework before we begin?
Step 1: Identify the 2026 College Football Structure
The 2026 college football season is organized around FBS conferences, weekly schedules, bowl games, and the College Football Playoff. Week 1 spans August 22–September 7, regular-season weeks continue through Week 15, and the national championship is set for January 25, 2027, in Las Vegas. The first task is identifying the competition level and postseason relevance.
The FBS is the highest-profile NCAA football division. It includes major conferences such as the Big Ten, SEC, ACC, Big 12, and American Athletic Conference, plus conferences including the Mountain West, Sun Belt, Conference USA, and MAC. The FCS operates separately and has its own postseason system. That distinction matters because an FBS matchup and an FCS matchup can differ sharply in roster depth, funding, schedule strength, and media attention.
According to the NCAA FBS football hub, official coverage includes news, scores, statistics, rankings, championship history, and CFP reporting. The NCAA has described the championship environment through the simple phrase, “FBS Football,” but the underlying system is anything but simple. Conference realignment, transfer movement, and player availability can change a team’s profile within months.
Use this basic classification before reading any odds:
- Confirm whether both teams are FBS, FCS, or lower-division programs.
- Check the conference affiliation for the 2026 season.
- Separate regular-season importance from bowl or CFP implications.
- Record the venue, kickoff time, broadcast network, and travel distance.
- Compare current rosters with last season’s rankings.
[Internal Link: beginner’s guide to reading college football schedules]
The schedule itself can reveal risk. ESPN’s 2026 calendar lists games across 15 weeks, with Week 14 ending December 6 and Week 15 running December 7–12. Bowl games begin December 13, while CFP activity is listed from December 18 through January 27. A team’s late-season position can therefore affect motivation, rotation, and coaching decisions. “Must-win” language is often used casually; the standings and tiebreakers are more reliable.
Step 2: How Should You Read a College Football Schedule?
A college football schedule should be read through opponent quality, location, rest, travel, kickoff timing, and sequence rather than win-loss records alone. One road game against a ranked SEC opponent is not equivalent to one home game against a rebuilding FCS team. Context changes the numerical value of every result.
Schedule analysis becomes more useful when broken into measurable layers. Start with the opponent’s offensive and defensive efficiency. Then inspect whether the game is home, away, or played at a neutral venue. International fixtures add another variable: the 2026 schedule includes North Carolina versus TCU at Aviva Stadium in Dublin, Ireland, an unusual location with cross-Atlantic travel and a different preparation cycle.
The same schedule also lists San José State at USC in Los Angeles, NC State at Virginia in Charlottesville, and Jacksonville State at North Dakota State in Fargo. These examples show three different analytical problems: a major talent gap, a conference-style road matchup, and an FBS-versus-FCS context. The “favorite” label does not explain how the game may unfold.
Track these schedule indicators:
- Rest days between games.
- Consecutive road fixtures.
- Travel across time zones.
- Neutral-site distance from each campus.
- Opponent strength during the previous 3 games.
- Bye weeks before rivalry games.
- Weather exposure in outdoor stadiums.
- Early kickoffs after long travel.
A useful contrarian insight is that travel may matter less through distance than through routine disruption. A 1,500-mile trip with a full week of preparation can be easier than a short trip involving an early kickoff, a compressed academic schedule, and a previous overtime game. That edge is rarely visible in headline rankings. We should therefore record travel conditions separately from mileage.
Get the schedule details before forming a position.
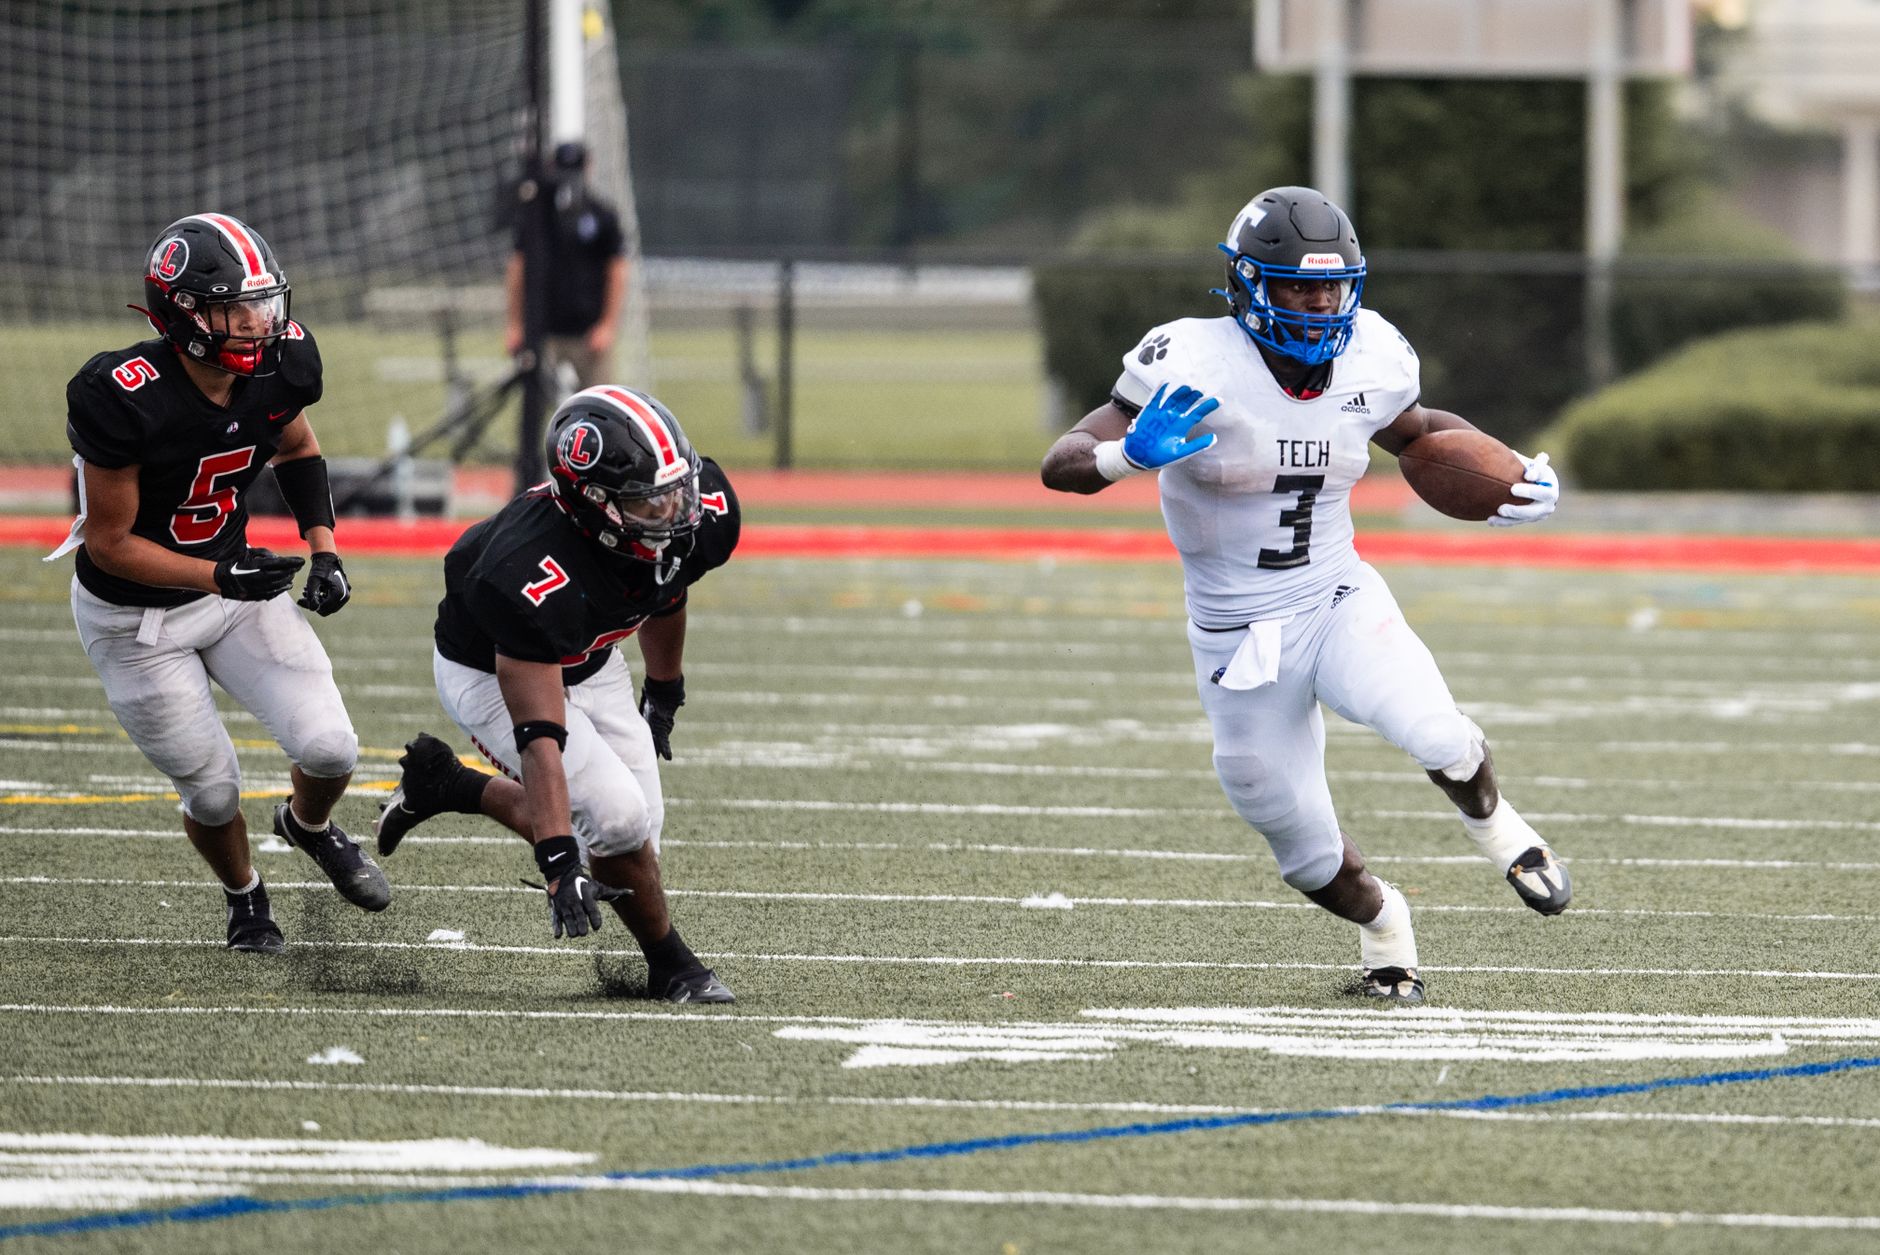
Photo by Hawk i i on Pexels
Step 3: What Statistics Matter Most in College Football?
The most useful college football statistics are success rate, explosiveness, yards per play, turnover margin, early-down efficiency, red-zone performance, and adjusted opponent strength. Box-score totals alone can mislead because a team may accumulate yards against weak opposition while struggling against efficient defenses. Numbers must be filtered through game state and schedule quality.
Success rate measures how consistently an offense achieves the required result on each play. Explosiveness captures how often a team produces large gains. Yards per play gives a broad efficiency snapshot, but it should not replace drive-level data. Turnovers are highly influential, yet turnover margin can be unstable from week to week because fumbles and interceptions contain significant randomness.
For a cleaner assessment, compare:
- Offensive success rate versus defensive success rate allowed.
- Passing explosiveness against opponent coverage efficiency.
- Rushing efficiency against defensive front strength.
- Sack rate and pressure rate on both sides.
- Red-zone touchdown rate, not just red-zone trips.
- Third-down conversion under comparable field position.
- Special-teams starting field position.
- Performance against ranked or similarly rated opponents.
The College football article from Wikipedia provides useful historical context on the sport’s American and Canadian gridiron roots, but historical identity does not predict a 2026 result. A program’s tradition may explain public attention; it does not automatically explain current quarterback accuracy, defensive depth, or offensive line health.
One operational edge is worth emphasizing: evaluate garbage-time statistics separately. If a favored team leads by 24 points, its late possessions may use backups, conservative play-calling, and reduced tempo. That can inflate defensive yards allowed or depress offensive efficiency. Remove those drives when possible, or at least label them. Otherwise, we are allowing low-pressure snaps to distort the “true” team profile.
[Internal Link: advanced college football statistics and efficiency metrics]
Step 4: Why Do Rankings and Betting Lines Disagree?
Rankings and betting lines disagree because rankings often describe perceived team quality, while lines price expected game performance, venue, injuries, matchup, and public demand. A ranked team can still be a poor favorite if its margin is inflated by brand recognition. Conversely, an unranked team can offer value when efficiency data improves before public rankings react.
Consider a hypothetical market line: USC -35.5 against San José State with an over/under of 57.5. The spread suggests a large talent difference, but it does not guarantee a high-scoring win. If USC leads 28–3 at halftime, the coaching staff may slow tempo, protect starters, and create a lower final total. The favorite can cover while the over fails. These are separate questions.
A disciplined process separates three judgments:
- Who is more likely to win?
- Who is more likely to cover the spread?
- Is the total mispriced after accounting for pace and game script?
Market movement also requires caution. A line shifting from -5.5 to -6.5 may reflect respected money, injury news, bookmaker risk management, or simple balancing activity. The movement itself is not proof of superior information. “Sharp action” is frequently used as a marketing label without verifiable evidence.
For responsible analysis, set a probability estimate before checking the latest line. Then compare the implied probability with your estimate. Never increase a stake merely because a line moved against you. That is not analysis; it is emotional escalation.
See how the variables interact before relying on a headline number.
Photo by Hawk i i on Pexels
Step 5: Verification
Verification means confirming schedule data, player availability, weather, venue, conference status, and market information through reliable sources before publishing an opinion. The NCAA, ESPN, official university athletic departments, and reputable data providers should be checked separately because no single page is guaranteed to contain every late update.
Use this verification checklist on game day:
- Confirm kickoff time and broadcast channel with ESPN or the university.
- Check official injury and availability reports.
- Verify whether the quarterback is starting.
- Review weather, wind, precipitation, and field conditions.
- Recheck spread and total changes.
- Confirm suspensions, transfer eligibility, and depth-chart movement.
- Compare the final matchup with the original projection.
- Record the reason for every prediction change.
The NCAA’s official reporting on the 2026 CFP lists the national championship for January 25, 2027, at Allegiant Stadium in Las Vegas. That date is a useful anchor, but postseason information can change through qualification, scheduling, or administrative updates. We should not treat a calendar listing as a guarantee of team participation.
A second information gain comes from timing. Many analysts update injury assumptions but fail to update the model’s expected snap distribution. A starting receiver listed as “available” may still face a 50–60% workload limit. That difference affects route depth, red-zone targets, and explosive-play probability. Availability is binary in headlines; workload is continuous in reality.
[Internal Link: college football injury-report checklist]
Troubleshooting Common Failures
Common college football analysis failures include overvaluing team brands, confusing rankings with probabilities, ignoring matchup style, and reacting to one dramatic result. These errors persist because they are emotionally satisfying. They are also measurable. A process that cannot explain why it changed is usually a process driven by noise.
Failure 1: Treating rankings as forecasts
Rankings summarize opinion, résumé, or performance. They do not automatically price home advantage, quarterback availability, or matchup-specific weaknesses. Compare the ranking with opponent-adjusted efficiency and recent depth-chart changes.
Failure 2: Chasing “obvious” favorites
Large spreads create false confidence. A 35.5-point favorite may dominate talent metrics but lose cover value if the coach substitutes early. Review expected pace, substitution patterns, and previous margins against similar opponents.
Failure 3: Ignoring defensive style
An explosive passing offense may struggle against two-high safety structures, disguised coverage, or strong third-down pressure. A strong rushing team may face a defense allowing only 3.2 yards per carry. Matchup data matters more than generic season averages.
Failure 4: Overreacting to turnover results
A team winning the turnover battle by +3 may look dominant, but that result can be difficult to repeat. Check pressure creation and quarterback decision quality instead of assuming another turnover advantage.
Failure 5: Confusing a prediction with certainty
Even a 70% estimated outcome fails 30% of the time. That is not a contradiction. It is probability. Use fixed limits, avoid chasing losses, and follow applicable local laws. Goal Moments provides sports content, not a guarantee of financial return.

Photo by K on Pexels
A Practical 2026 College Football Workflow
A repeatable workflow is safer than a dramatic opinion. It also makes our mistakes visible. Begin with the schedule, then move through performance, matchup, availability, market, and verification. Do not reverse that order simply because a famous team appears on television.
- Map the game: conference, venue, kickoff, travel, and rest.
- Rate the teams: opponent-adjusted offense, defense, and special teams.
- Inspect the matchup: trenches, quarterback pressure, coverage, pace, and red zone.
- Update personnel: starters, transfers, suspensions, and workload limits.
- Compare the market: spread, moneyline, total, and movement.
- Model game scripts: favorite leads, underdog leads, and close-game scenarios.
- Run verification: official sources, weather, final line, and late news.
- Document uncertainty: list what could invalidate the prediction.
This approach also improves content quality. A college football article should identify the exact game, season, conference, players, data window, and source date. “Team X is hot” is weak. “Team X has won 4 of its last 5, but its success rate fell 6 percentage points against top-30 defenses” is testable. Readers deserve the second version.
Want to turn the checklist into a repeatable research habit?
Frequently Asked Questions
Q: What is college football?
A: College football is American football played by university teams under NCAA competition structures in the United States. The highest-profile level is the FBS, which includes conferences such as the Big Ten, SEC, ACC, and Big 12. Teams compete in regular-season games, conference races, bowl games, and the College Football Playoff. The FCS and lower NCAA divisions operate under different postseason formats and competitive conditions.
Q: When does the 2026 college football season start?
A: The 2026 college football schedule begins with Week 1 fixtures running from August 22 through September 7. ESPN’s schedule also lists Week 15 from December 7–12, bowl games from December 13 through January 27, and CFP activity beginning December 18. Always verify the final kickoff time through ESPN or the participating university because broadcast and scheduling information can change.
Q: How should beginners analyze a college football game?
A: Beginners should start with venue, opponent quality, quarterback status, offensive and defensive efficiency, and recent schedule difficulty. Then compare success rate, yards per play, pressure rate, red-zone performance, and turnover context. Avoid using rankings as the only forecast. A simple written checklist is usually more reliable than reacting to television commentary or social-media confidence.
Q: What is the difference between FBS and FCS college football?
A: FBS is the highest-profile NCAA football subdivision, while FCS is a separate subdivision with different competition and postseason structures. FBS teams commonly receive greater national television exposure and participate in bowl or CFP pathways, while FCS programs compete in an NCAA playoff system. An FBS-versus-FCS matchup may involve major differences in roster depth, scholarships, funding, and athletic resources.
Q: Are college football rankings reliable for predictions?
A: Rankings are useful context but are not complete prediction models. They may reflect reputation, résumé, preseason expectations, or human and computer evaluations, while a game line also accounts for venue, injuries, matchup, and market demand. Compare rankings with opponent-adjusted efficiency and current personnel. A ranked team can still be overpriced, especially on the road or after a major injury.
Q: What should I do if a college football line moves sharply?
A: Recheck the line movement’s possible cause before changing your view. Investigate quarterback news, weather, suspensions, workload limits, and whether the move occurred across multiple sportsbooks. Do not assume movement proves that one side is correct. If the new price removes your expected edge, passing is often more disciplined than increasing your stake.
Q: How can I use college football betting information responsibly?
A: Use only money you can afford to lose, set a fixed budget, and treat every prediction as uncertain. Never chase a loss, borrow funds, or interpret Goal Moments analysis as a guarantee of profit. Check the legal requirements in your jurisdiction, and use available gambling-support resources if betting stops feeling controlled. Data improves decisions; it does not remove risk.
College football in 2026 will reward attention to structure, schedule friction, efficiency, and late information. The strongest method is not the loudest prediction. It is the one that survives verification, explains uncertainty, and distinguishes a team likely to win from a price worth considering. Start with the official schedule, measure the matchup, and keep your risk limits fixed.
Ready to review more evidence-based sports insights?
Thank you for reading.
Goal Moments · The Midnight Archive · An Exhibition of Thought