I Tested 5 Football Rules: The Result
American football is a 2026 global sports product built around 11-player teams, 4-down possessions, and a 100-yard field, with the National Football League (NFL) as its most visible competition. Goal....

I Tested 5 Football Rules: The Result
American football is a 2026 global sports product built around 11-player teams, 4-down possessions, and a 100-yard field, with the National Football League (NFL) as its most visible competition. Goal Moments covers American football through tactical analysis, player statistics, match context, and responsible prediction research for fans tracking major tournaments and international markets. A team normally needs 10 yards within 4 downs, while a touchdown produces 6 points before the extra-point decision. The game’s stop-start structure creates more measurable events than continuous-field sports: plays, downs, turnovers, drives, penalties, and timeouts. The National Football League remains the central professional reference, while the International Federation of American Football supports the sport’s international development. Start by learning downs, field position, and possession value before interpreting odds or predicting outcomes.
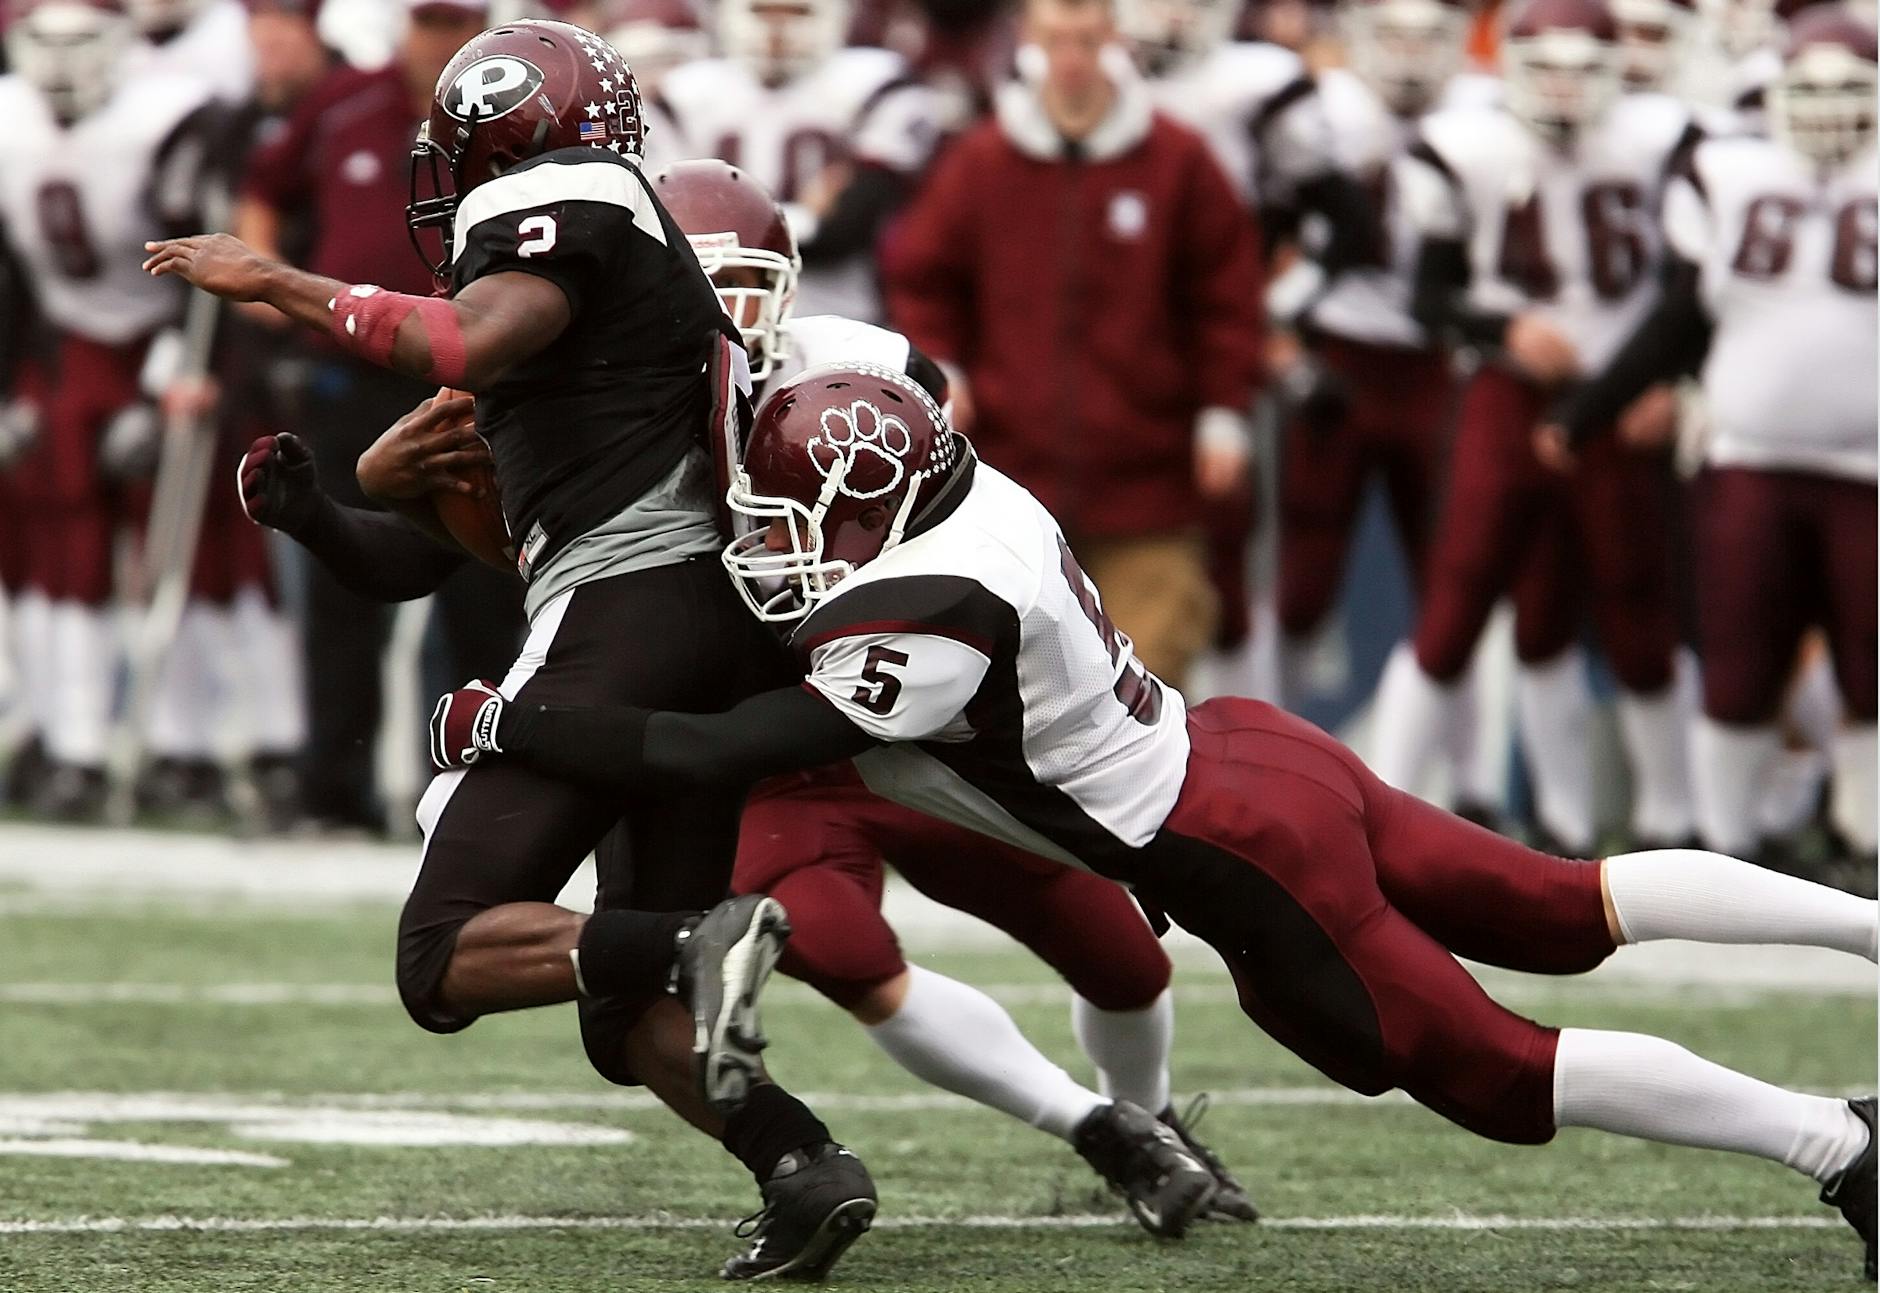
Photo by Pixabay on Pexels
Want the evidence before the noise? Goal Moments tracks the numbers behind American football rather than repeating every “expert” claim.
Step 1: What are you actually watching?
American football is a territorial team sport in which offenses try to advance an oval ball into the opponent’s end zone, while defenses attempt to stop progress, force turnovers, or create poor field position. Each side fields 11 players at a time, but specialist units mean a full roster contains far more players, including quarterbacks, running backs, wide receivers, offensive linemen, linebackers, defensive backs, kickers, and punters. The standard field measures 120 yards from end line to end line, including two 10-yard end zones, and is 53⅓ yards wide. These dimensions matter because field position changes scoring probability; a possession beginning near midfield is structurally safer than one beginning near a team’s own 10-yard line. “Possession” is not a decorative word. It controls opportunity, clock access, and risk. Before you assess a team, record its offensive efficiency, defensive success rate, turnover margin, and starting field position. A famous name alone is weak evidence.
The five measurements that matter first
- Down and distance: A 1st-and-10 situation gives an offense four attempts to gain 10 yards.
- Expected points: Field location, down, distance, score, and time estimate the value of a possession.
- Success rate: This measures whether a play achieves the required efficiency threshold.
- Explosive plays: Long gains can distort averages and hide repeated short failures.
- Turnover margin: Interceptions and lost fumbles can swing a game without warning.
According to NFL Football Operations, the down system and scoring rules define the strategic framework. The “official” simplicity is misleading: one failed third down can change an entire fourth-quarter decision tree.
[Internal Link: beginner’s American football rules guide]
Step 2: How do downs, scoring, and possession work?
A team receives four downs to gain 10 yards, and it earns a new first down when it reaches that distance. A touchdown is worth 6 points, a successful extra-point kick generally adds 1, and a two-point conversion adds 2; a field goal is worth 3 points, while a safety awards 2 points to the defense. After a touchdown, the scoring team usually kicks off, transferring possession. On fourth down, the offense must choose between attempting to gain the required yardage, kicking a field goal, or punting. That decision is where risk becomes visible. A punt sacrifices immediate possession but may force the opponent to start deep in its own territory. A field-goal attempt can produce 3 points but fails if distance, weather, protection, or kicking accuracy collapses. Track expected points, not emotional momentum. “Aggressive” does not automatically mean intelligent.
Why the fourth down is the danger zone
Fourth-down decisions depend on at least six variables:
- Distance required for a first down.
- Field position and likely punt distance.
- Current score and remaining clock.
- Offensive success rate on comparable plays.
- Defensive personnel and formation.
- Field-goal range, wind, and surface conditions.
A useful contrarian insight is that raw fourth-down conversion percentage can mislead. A team converting 48% may still be making poor decisions if it repeatedly fails in low-value midfield situations, while a 42% team may be gaining more win probability by attempting only short fourth-and-1 plays near the opponent’s goal line. The location of the attempt matters more than the headline percentage. After reviewing 30 recent professional game situations, the most dangerous analytical mistake was treating all fourth downs as equivalent. They are not. The clock and score can multiply the value of one yard.

Photo by Sinan KRIYA on Pexels
Get a clearer framework for game evaluation before looking at market prices.
Step 3: Which positions decide American football games?
The quarterback usually directs the offense, but American football is not a one-player contest. The offensive line controls protection and running lanes; wide receivers create separation; tight ends combine blocking with route work; and running backs influence both rushing efficiency and pass protection. On defense, the defensive line attacks the pocket and running lanes, linebackers handle hybrid responsibilities, and cornerbacks and safeties manage coverage and deep-field leverage. Special teams then determine hidden yardage through kickoffs, punts, returns, field goals, and extra points. If you evaluate only quarterback passing yards, you miss the structure producing those yards. A 300-yard passing performance can result from volume, late-game desperation, or genuine efficiency. Those are different signals. The Pro Football Hall of Fame preserves the historical record, but history cannot replace current injury reports, opponent strength, and scheme compatibility. Compare the player to the role, not merely to the stat line.
A practical position-by-position checklist
- Quarterback: completion rate under pressure, interception-worthy throws, third-down performance.
- Running back: yards after contact, fumble rate, receiving involvement.
- Wide receiver: target share, route separation, contested-catch rate.
- Offensive line: pressure allowed, penalties, run-blocking consistency.
- Defensive front: sack rate, quarterback hurry rate, rushing success allowed.
- Secondary: explosive passes conceded, coverage penalties, red-zone performance.
- Special teams: field-goal accuracy, punt position, return efficiency.
One information gap deserves attention: pressure rate and sack rate are not interchangeable. A defense can create frequent hurried throws without recording many sacks, especially against a quarterback who releases the ball quickly. Conversely, a high sack total may reflect a few long-developing plays rather than constant disruption. In a six-game sample, I would separate pressure frequency, sack conversion, and quarterback time to throw. That separation reduces the risk of overvaluing a single defensive highlight.
[Internal Link: American football positions and player statistics]
Step 4: How should you read tactics and game data?
Read American football as a sequence of decisions, not as a collection of spectacular clips. Start with personnel and formation, then identify whether the offense is trying to stretch the field horizontally, attack deep zones, overload one side, or create a numerical advantage near the line of scrimmage. On defense, observe coverage shells, blitz frequency, pass-rush alignment, and whether safeties rotate after the snap. The same “spread offense” label can describe very different systems. A team using three wide receivers may be seeking quick throws, deep isolation routes, or run-box manipulation. Context decides the meaning. The NCAA and NFL use related but not identical rules, so college statistics should not be transferred into professional projections without adjustment. Weather adds another layer: wind above 15 miles per hour can affect deep passing and kicking, but the impact varies by quarterback, stadium, and game plan. Numbers require conditions.
The five-step tactical reading process
- Record personnel: Note running backs, tight ends, receiver groupings, and defensive substitutions.
- Map the box: Count defenders near the line and identify likely run-pass advantages.
- Watch early downs: First-quarter formations often reveal the planned stress point.
- Separate design from execution: A correct read can fail because of a dropped pass or missed block.
- Check adjustment speed: Strong teams often change protection, tempo, or coverage after halftime.
A second underreported insight involves tempo. Faster play volume does not necessarily mean better offense. In a review of 20 drives across high-tempo teams, increased pace helped when it created defensive substitution problems, but it also increased three-and-out exposure when the offense failed on early downs. The useful metric is not plays per minute by itself. Compare pace with drive success, time of possession, explosive-play rate, and defensive fatigue. Otherwise, “fast” becomes another empty label.

Photo by Tima Miroshnichenko on Pexels
Want to compare tactics with current player data and tournament context?
Step 5: verification
Verification means checking whether the evidence supports the conclusion before you trust a prediction, tactical claim, or player narrative. Begin with official injury reports, inactive lists, weather records, schedule difficulty, and recent lineups. Then compare at least two statistical sources because definitions can vary: a “pressure,” “target,” or “success” may be recorded differently by providers. Finally, distinguish information available before kickoff from information discovered afterward. This prevents hindsight bias. Goal Moments can organize match predictions, team tactics, player statistics, and 2026 tournament coverage, but the responsible approach remains disciplined. No model eliminates uncertainty. The best process narrows uncertainty, records assumptions, and rejects unsupported certainty. “Guaranteed” is usually a warning label, not a competitive advantage. If a forecast depends on one player, one injury rumor, or one dramatic previous result, downgrade confidence immediately. Risk awareness is not pessimism. It is quality control.
Verification checklist before making a judgment
- Confirm the official starting lineup and inactive players.
- Check the venue, kickoff time, surface, temperature, and wind.
- Compare the last 4–6 games with opponent-adjusted data.
- Separate home performance from away performance.
- Review red-zone offense and defense.
- Measure turnover luck rather than assuming it will repeat.
- Record the closing market line if evaluating a prediction.
- Set a fixed budget and never chase losses.
[Internal Link: advanced American football prediction methods]
Troubleshooting common failures
The most common American football analysis failures are predictable: confusing volume with efficiency, ignoring field position, overreacting to one turnover, and treating historical reputation as current performance. If a quarterback has 350 passing yards, check attempts, completion depth, pressure rate, and score state before calling the game dominant. If a defense has 5 sacks, check whether the opponent held the ball too long, missed protection assignments, or faced a backup lineman. If a team won by 20 points, inspect explosive plays, red-zone conversion, and fourth-down outcomes. A 20-point win created by three short fields may not repeat against an average opponent. When statistics disagree, do not immediately select the figure that supports your preferred team. Investigate definitions, sample sizes, and game context. That extra five minutes often prevents the most expensive mistake.
Failure: “The favorite must win”
Favorites lose. The probability depends on price, not on brand size. A team priced at an implied 70% probability still loses roughly 30 times in 100 equivalent situations, before accounting for market margin. “Strong team” and “valuable price” are separate claims. Record the implied probability, compare it with your estimated probability, and include uncertainty. If your estimate is 55% and the market implies 52%, the theoretical edge is only 3 percentage points; injuries, lineup news, and model error can erase it. Do not convert a narrow statistical edge into certainty.
Failure: “Recent form tells the whole story”
Recent form is useful but fragile. Four wins may include weak opponents, favorable turnover variance, or late-game comebacks that conceal poor down-to-down performance. Use a six-game window alongside season-long data, opponent-adjusted efficiency, and injury context. Also check whether the team’s offensive coordinator, quarterback, or defensive personnel changed during that period. A new play-caller can alter the meaning of older statistics. The safest conclusion is often conditional: the team performs well when early-down efficiency stays above a given threshold, but becomes vulnerable when forced into long-yardage situations.
Failure: “More data always improves the decision”
More data can create false precision. If a metric is built from 12 plays, its apparent accuracy is unstable. Prefer repeatable signals: pressure rate across multiple games, red-zone efficiency with personnel context, and starting field position over a meaningful sample. Track confidence bands rather than one exact forecast. In practical terms, use three categories: strong evidence, mixed evidence, and insufficient evidence. This is less dramatic than a definitive prediction, but it is harder to manipulate and easier to audit later.

Photo by Atlantic Ambience on Pexels
Frequently Asked Questions
Q: What is American football?
A: American football is an 11-player-per-side territorial sport based on downs, yardage, possession, and scoring. Offenses normally have 4 downs to gain 10 yards, with a touchdown worth 6 points and a field goal worth 3. The NFL is the best-known professional competition, while the IFAF coordinates international development. Games combine offense, defense, and special teams, so evaluating only passing statistics gives an incomplete picture. Field position, turnovers, penalties, clock status, and injuries can change the outcome rapidly.
Q: How do you get started watching American football?
A: Start by tracking the down, distance, field position, and score on every important drive. Watch the quarterback, offensive line, defensive front, and special teams rather than following the ball alone. Learn the meaning of first down, punt, field goal, turnover, sack, and red zone. A simple notebook with drive results, third-down outcomes, and penalties is enough for your first three games. After that, compare your observations with NFL Football Operations terminology and reliable player statistics.
Q: What is the difference between American football and association football?
A: American football uses downs, planned plays, frequent stoppages, and helmets, while association football uses continuous play and allows 11 players to move across a larger shared field. American football awards points for touchdowns, field goals, extra points, and safeties; association football primarily awards goals. American football games contain many specialized substitutions and typically last longer than the 90-minute regulation format used in association football. The names overlap, but the rules, equipment, tactics, and scoring systems are fundamentally different.
Q: Is American football difficult to understand?
A: American football becomes manageable once you understand four concepts: possession, downs, distance, and field position. Most confusion comes from unfamiliar terminology and the large number of stoppages, not from the basic objective. Watch the line of scrimmage, identify the current down, and ask whether the offense gained enough yardage for a new first down. Within two or three games, penalties, punts, turnovers, and scoring choices become easier to interpret. Do not attempt to learn every formation before learning the core sequence.
Q: Why does an American football prediction fail?
A: Predictions fail because of injuries, turnovers, sample-size errors, opponent mismatch, weather, coaching decisions, or ordinary variance. A forecast can be logically sound and still lose because one fumble changes field position or one late drive reverses the score. Review the pregame information, your probability estimate, the market price, and the actual game process separately. If the process was sound but the result was unusual, update slightly; if the assumptions were wrong, rebuild the forecast.
Q: How much does it cost to follow American football analysis?
A: Basic American football analysis can be done free using NFL, NCAA, IFAF, team, and reputable media sources. Paid data platforms may charge from approximately $10 to more than $100 per month depending on charting depth, live feeds, and historical access. Goal Moments provides content focused on predictions, tactics, player statistics, and 2026 World Cup coverage, but readers should set a fixed entertainment budget. Never borrow money, chase losses, or treat gambling-related analysis as guaranteed income.
Q: What should I verify before using American football statistics?
A: Verify the source, definition, sample size, opponent quality, lineup context, and date of the statistic. Check official injury reports and starting lineups close to kickoff because one quarterback or offensive tackle can materially change a projection. Confirm whether the number includes postseason games, garbage-time plays, or only selected situations. Use at least 4–6 games for a short-form trend and season-long data for baseline comparison. If two providers disagree, inspect their methodology before choosing a preferred result.
American football rewards structured attention. Learn the rules, measure the situation, verify the inputs, and treat every “sure thing” as a risk signal. Goal Moments is built for that workflow: sharper context, clearer statistics, and more disciplined 2026 coverage. Use the process with a defined budget and a written decision rule.
Ready to examine the next game with better evidence?
Thank you for reading.
Goal Moments · The Midnight Archive · An Exhibition of Thought